
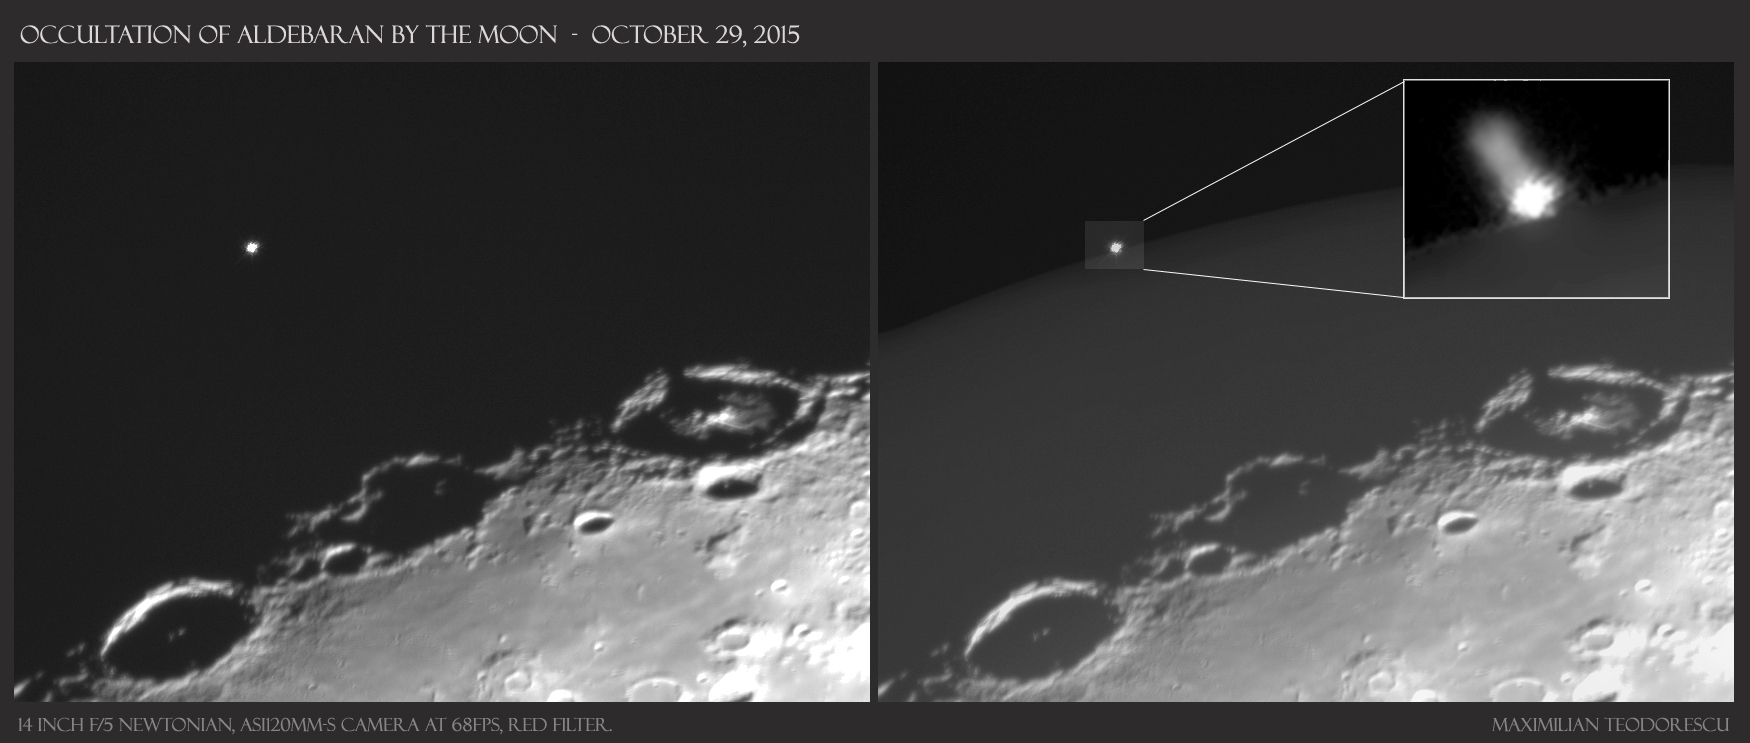
On the night of October 29/30 a nice event took place: the occultation of Aldebaran (Alpha Tauri) by the Moon.
I was present at the event together with my brother-in-law and the 14inch F/5 Newtonian. Due to preparing a following lunar imaging session, I was unable to catch the ingress (the moment the Moon occulted the star), but I was able to image the egress of Aldebaran from behind the Moon. This happened on the shadow-filled part of the visible face of our satellite.
The equipment used for the images was: the 355mm F/5 homemade Newtonian (SkyWatcher optics), the ASI 120MM-S camera placed at the focal plane of the scope, and a Baader Red filter. The camera worked at 68fps with 14 millisecond exposures. Seeing conditions: 4-5/10. Location: a corn field near the village of Dumitrana, Ilfov county, Romania. Coordinates: 44d19m18.9s N, 25d59m09.6s E.
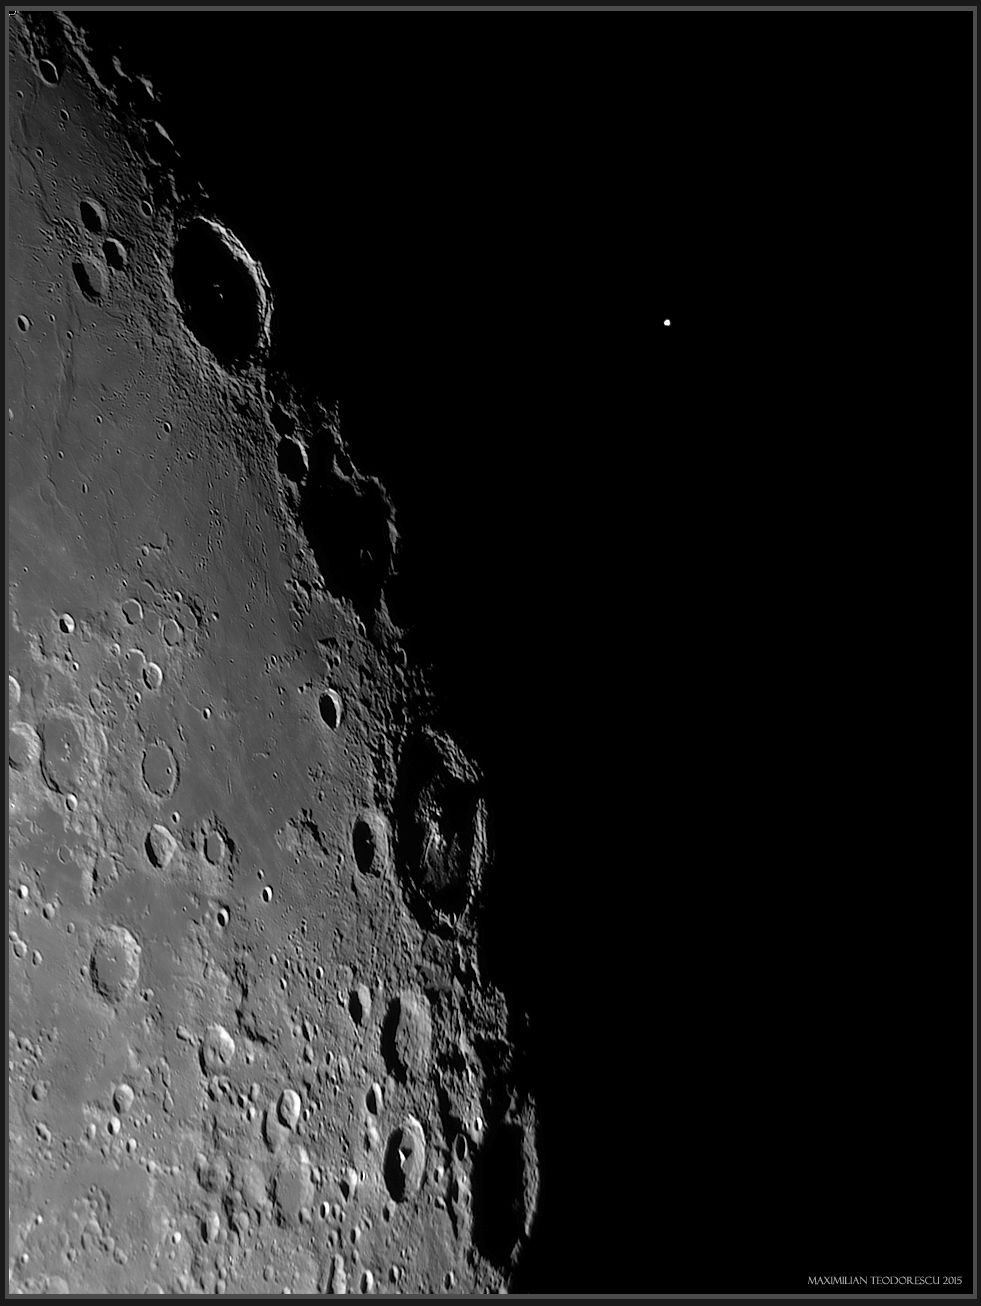
The image below is a stack of 1000 frames for both the Moon and Aldebaran, assembled together in order to better present the event. The position of the star relative to the Moon is for around 20-30 seconds after the egress. The most notable craters present on the terminator at the moment of the event: Langrenus (upper left), Vendelius (below Langrenus), Petavius (with the shadow of its central peak projected onto the walls) and Furnerius (bottom).
The animation showing the event at 50 fps, a bit slower compared to the actual event (which was imaged at 68fps) showing the fast reappearance of Aldebaran:
This is almost the way the event looked to our eyes on the laptop screen. But processing this sequence revealed a different aspect: a fast but gradual emergence of the star from behind the Moon.
Following is a 2 fps animation showing the event at a speed 34 times slower:

To better show the gradual egress, the following sequence was composed from cropped versions of the frames, in two versions, one with no processing and the other with mild processing. Notice the fact that after processing the frames the star is showing on many more frames before the actual egress. This is quite peculiar, and will be explained partially later.
Now, the sequence, with the first frame considered at T=0ms:
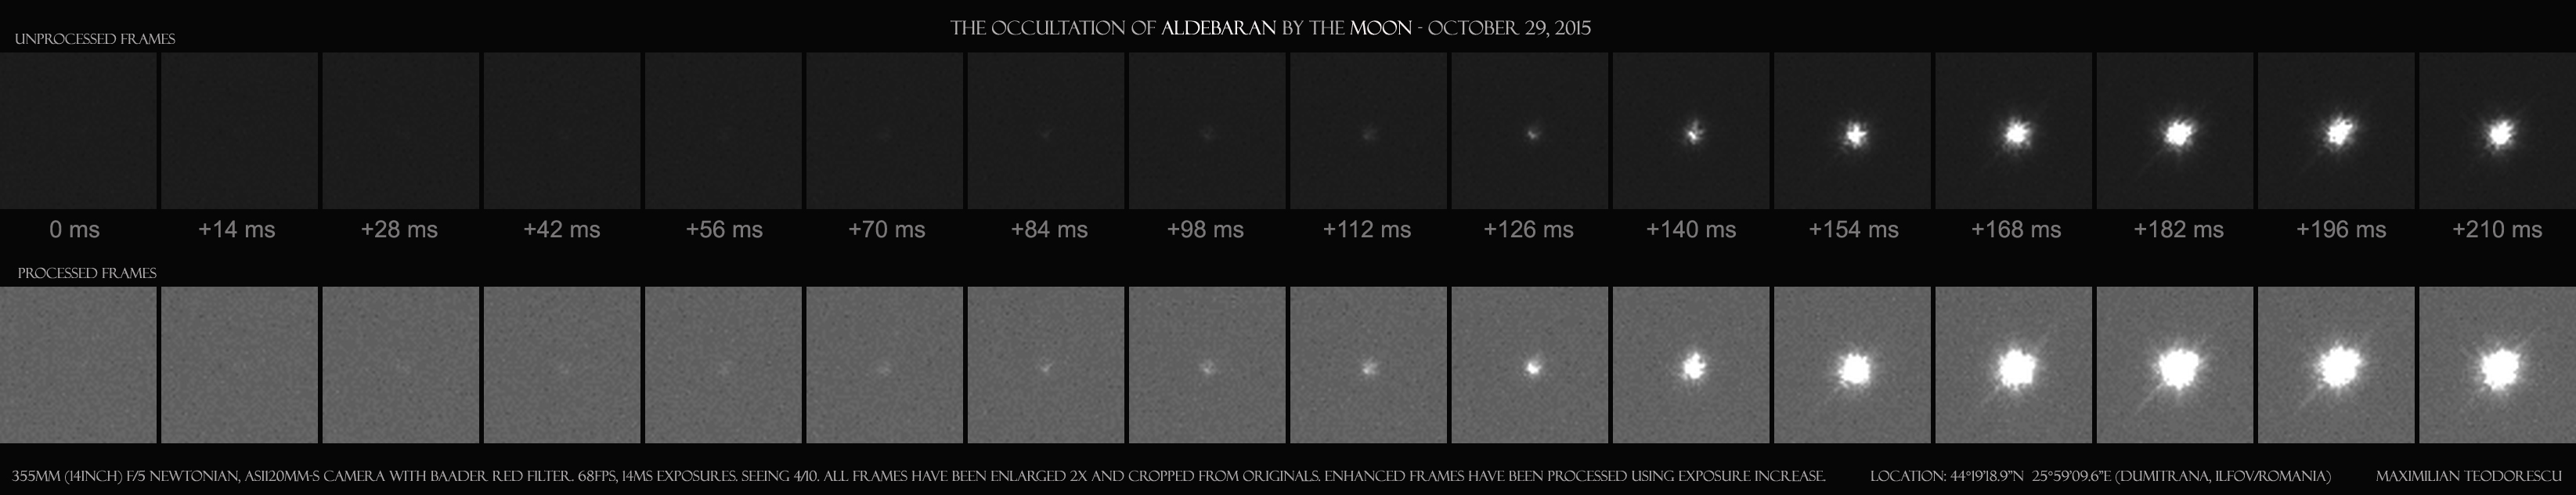
It can be observed that some light from Aldebaran starts being visible after the first 14ms, followed by a very small increase in brightness up until +84ms. From this moment on, the amount of light increases faster for the next two frames (+84 to +98ms). From the +98ms frames, the brightness increases very fast until +182ms. This is the moment Aldebaran fully emerges from behind the Moon, the rest of the frames showing the star with a constant brightness.
Now, for a theoretical uniform disc of the star (good assumption in general), the event should have happened in a more linear way.
The following plot shows both the above sequence and the relative brightness extracted from the images using the standard deviation measurement tool in Photoshop:
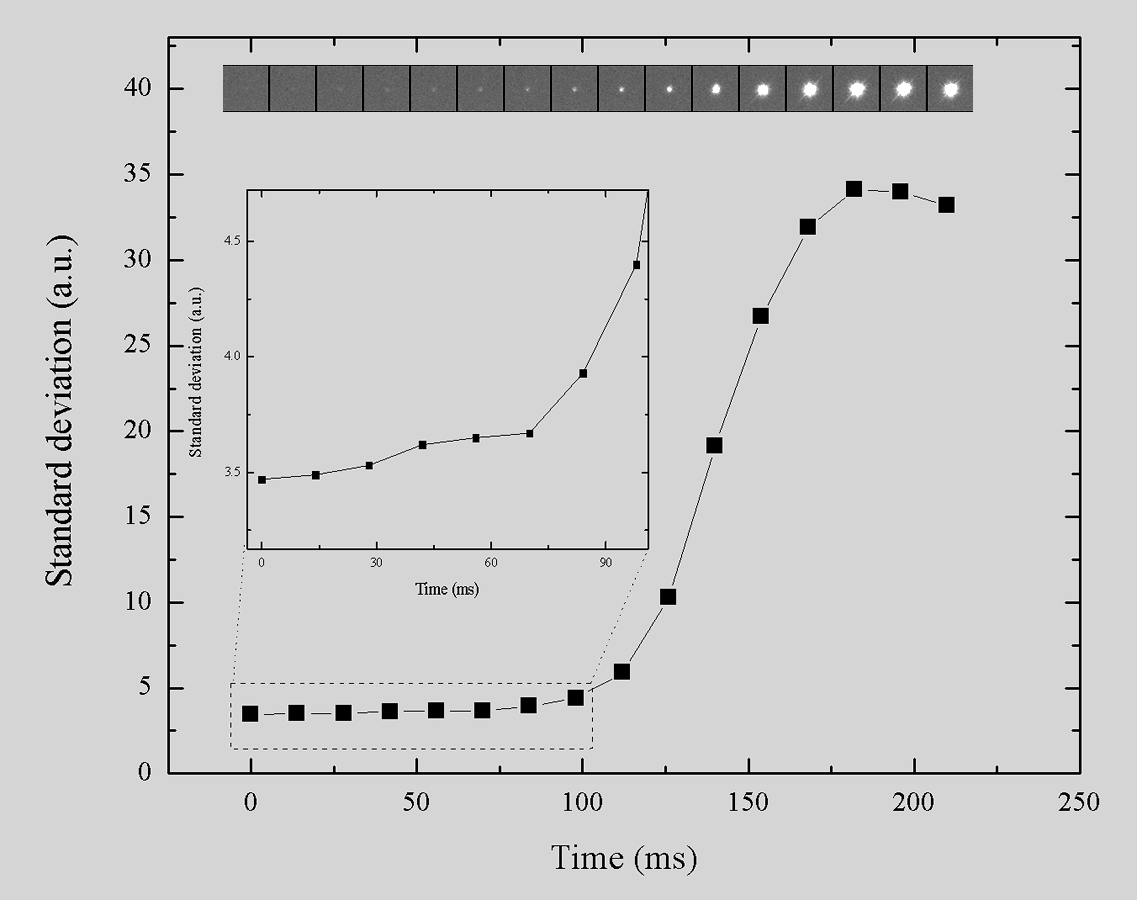
There is an inset presenting in more detail the first points and their slight variation.
Despite the small number of points, the general evolution in brightness is well presented.
The issue with the first set of points, the ones showing the only partial egress of Aldebaran, must be investigated further.
For such an evolution to be real, it would mean that on the lunar surface there must be some formations occulting the star unequally (a mountain, small hill, or valley). To determine if this could be possible, some calculations must be done:
-the diameter of the Moon is 3476km or, at the distance of 363205.4km (at the moment of the event, October 29, 23:10 U.T.) expressed in arcminutes, 32.9′ (that is 1974 arcseconds).
-the apparent speed of the Moon in the sky is about 0.52arcseconds per second.
Let’s consider a duration of the event of 0.1seconds. Since 3476km is 1974 arcseconds, and the speed of the Moon is 0.55 arcseconds per second of time, then in the one second the Moon moves about: 3476 x 0.55 / 1860 = 1.02km. That means that, in 0.1 seconds of time, the Moon moves 0.055 arcseconds, which at the surface of the Moon is about 100 meters. The event in the plot above shows a time duration for the first points (the inset) of around 90ms, that is 0.09s, which in meters at the Moon surface is 90m. If so, then a small hill or depression could be responsible for the abnormal brightness variation of the star.
This means that the first points in the plot must not be taken into account for measuring the event’s true duration. The start of the “real” event must be computed as in the following “revised” plot, where the two red lines show the linear part of the event (with the first line intersecting the time axis at around 110ms, and the second red line perpendicular to the time axis at the 180ms mark).
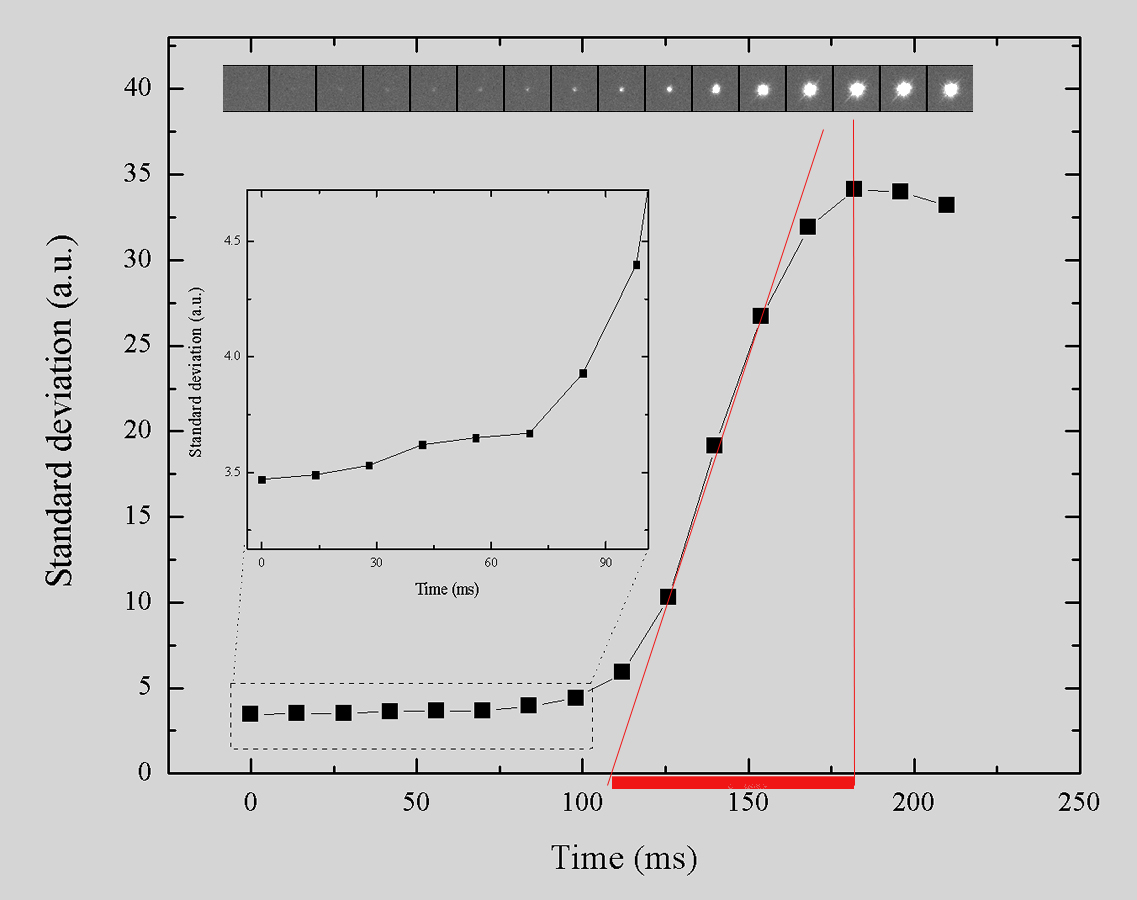
From the plot above, a “corrected” time of the event can be extracted: around 70 milliseconds.
Now, let’s get back to the lunar limb issue. To be able to measure very precisely an event such as the one discussed here, the star has to be occulted (either ingress or egress) behind a very flat lunar limb, and also to have a perpendicular direction of movement in respect to the limb. In the present case however, these two aspects did not occur, both due to some nonuniform lunar limb (as shown above), and due to a non-perpendicular direction of movement.
The direction of movement was determined by overlaying the shape of the lunar limb (extracted for the time of the event using Virtual Moon Atlas) onto a processed series of frames (processing which was done also with the stack point selected on the Moon to show the star movement as a trail):
The angle formed by the star trail with the perpendicular at the lunar limb has a value of around 15 degrees. This means that the time variation due to this angle is actually rather small.
For a time period of 1 second, the perpendicular will have a value of 0.52 arcseconds, equal with the speed of the Moon. This means that if cos of 15 degrees (the angle between the perpendicular and the actual trail of the star) is 0.96, the length of the trail for the same amount of time (1sec) is: 0.52 / 0.25 = 0.54. In other words, this means that for the angle at which the star is emerging, the time increase for the egress is only 1.038 times longer compared to a perpendicular emergence. This is too insignificant to be taken into account compared to other perturbations.
Why is this important?
Well, it is known that from such events (lunar occultations), a few stellar diameters were determined. How? Well, in short the answer relates to the following formula:
D=VxT,
which means that the distance traveled by an object is equal to its speed times the duration of the measurement.
In the case of a star occultation:
Dstar=Vm x Tocc.
That is: the diameter of the star (Dstar, measured in arcseconds) is equal to the speed of the Moon (Vm, measured in arcseconds per second) times the duration it takes for the Moon to cover/uncover the disc of the star (Tocc, measured in seconds).
For the Aldebaran occultation, measured from the above frames, Tocc is about 70 milliseconds, or 0.07s. The speed of the Moon is, as mentioned above, about 0.52 arcseconds per second. This results in a diameter for Aldebaran of around 0.036 arcseconds.
The actual measured diameter of Aldebaran (by astronomers using both similar and different techniques) is around 0.02 arcseconds. The physical diameter of the star (measured using distance data coming from the Hipparcos satellite, and the above mentioned apparent size measured from ground-based observatories) is around 62 million kilometers (44 times larger than the Sun). From my measurements, the size of Aldebaran would be around 111 million kilometers. Which is almost twice the known size.
Which means that something is wrong with my measurements. Not the calculus, since I’ve done it a number of times trying to understand where the errors come from.
The entire problem simplifies to one parameter: the duration it takes for the star to completely reappear from behind the lunar limb. Those 70 milliseconds.
This is the only parameter I cannot change, since it is a correct measurement (extracted directly from the data). As for the acquisition: the camera frames per second parameter is correct, as are all the aspects regarding the data transfer (no data lost or double frames).
A different parameter, which still cannot compensate entirely for the errors, is the seeing/scintillation at the moment of the observation. Seeing conditions were indeed not very good, but not very bad either. Plus, the linear part of the brightness increase in the plots above shows that there wasn’t any important degradation of the star image in those moments.
Only one parameter seems to be responsible: local formations on the lunar limb. Still, this does not answer for the linear increase in brightness. Not completely.
There is still one optical issue which I must investigate further: diffraction. Diffraction is an important factor in telescopic observations, and since the theoretical limit of the scope used (a 355mm one) is around 0.33 arcseconds, around 10 times larger compared to the measured star size (0.036 arcseconds), this could be the “missing link” in my error determination.
It seems that I still have a lot to investigate, but for now I’m pleased with a result. Any result. The above analysis proved to me that some measurements of astrophysical value (either correct or wrong) can be performed with amateur equipment, and amateur mentality:)
I’m still reading and finding articles regarding stellar diameter measurements during lunar occultations, so perhaps I will understand where the errors come from.
A few links to such articles,if anyone is interested:

2 Replies to “Lunar occultation of Aldebaran – October 29, 2015”